We put pride and passion into clear and easy-to-understand visualizations and data presentations.
With our responsive and interactive web service, VisualDB, you can follow trends and understand the flow of traffic and people. Get an overview or dig deeper into the data. The result is easy to export and share.

All traffic data is sent wirelessly in real-time to VisualDB, where you and your colleagues can view data anytime, anywhere, and from any type of device.

Link and share data directly on your own website. Export data to Excel or generate a monthly report with your logo and your own comments to share with colleagues or other stakeholders.

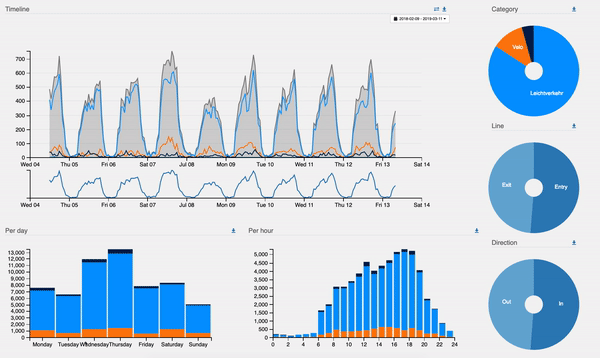
VisualDB is built to be easy to understand, intuitive and user friendly. Click and drag. Change time interval and category. Search deeper or get an overview.

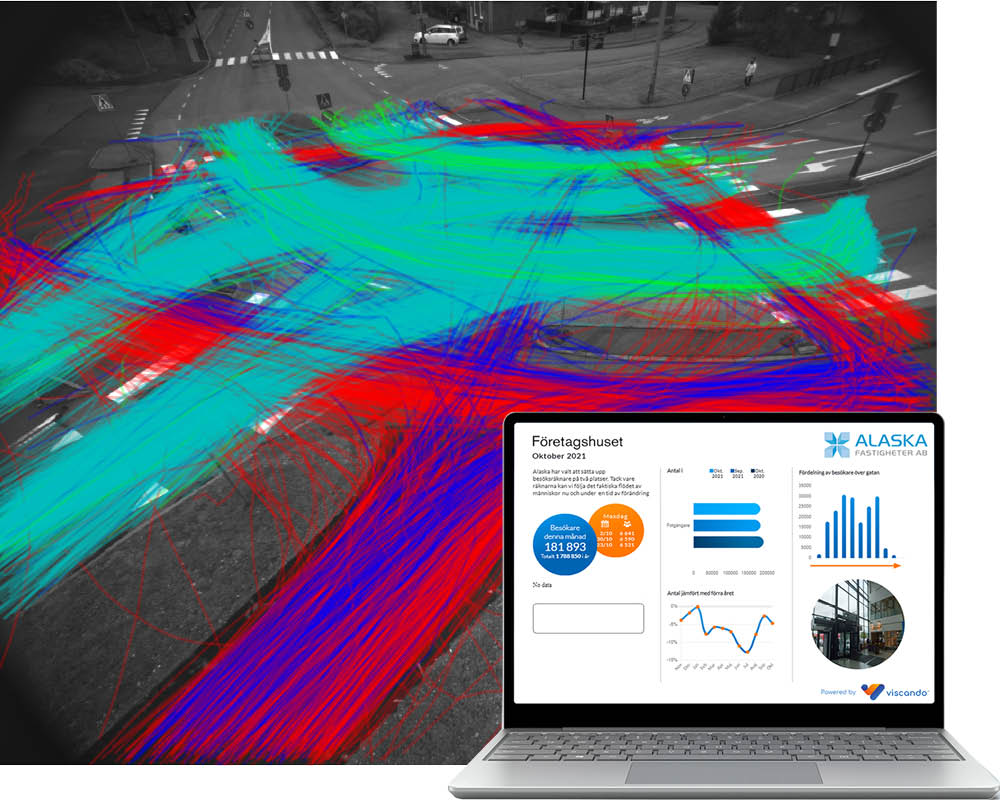
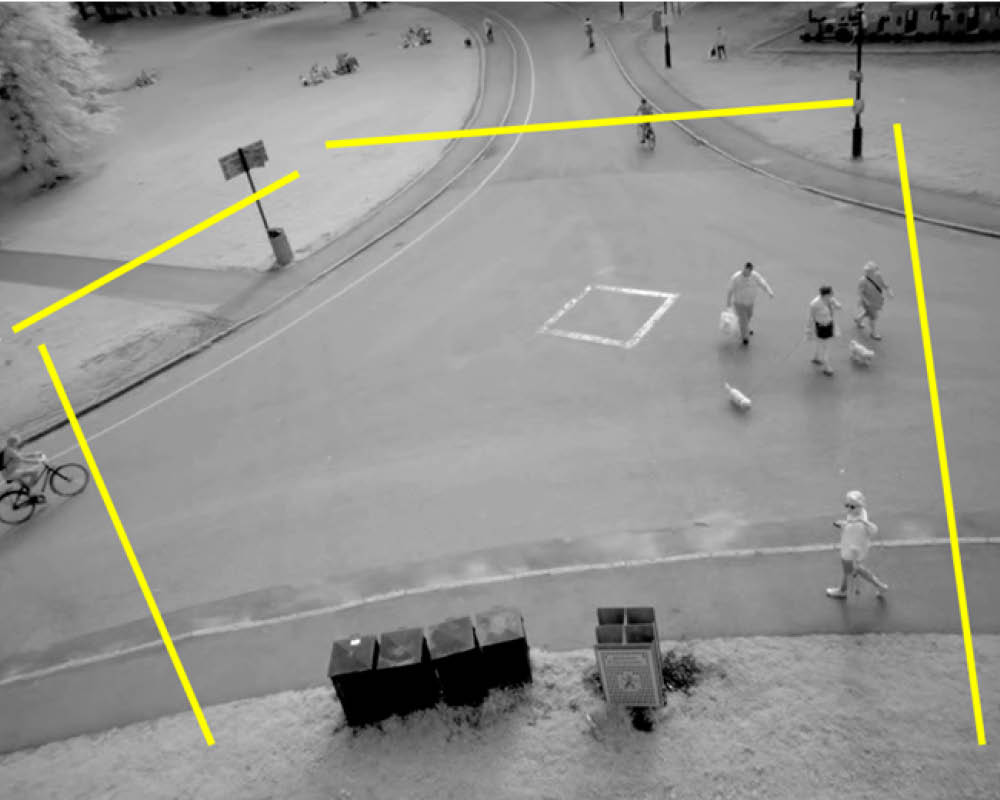
Viscando captures the exact movements, speed, direction and time for each road user, giving you detailed, high-precision data.

Walking and cycling are often affected by weather conditions. With weather data directly in the web service, it becomes easier to compare the effect of your events and changes.

Our interactive map gives you an overview of all your measuring sites. Zoom in to see the trend at each site. Does cycling increase as expected? Do the trends agree with your plans?

Our customized monthly report presents your key performance indicators (KPIs) on a simple, one-page overview. Easy to understand and share. All stakeholders on the same page, simplifying dialogue with everyone, contributing to your common goals.
Even our basic measurements give you more information and knowledge than traditional counting. In addition to counts, the detection of speeds and directions enables you to understand how road users affect each other’s mobility and safety.
Our more advanced measurement system, Traffic Insight, not only collects numbers, directions and speeds, but also each road user’s exact movement through the area. Viscando’s analysis quantifies both traffic behaviour and interactions, providing detailed and accurate data on how changes affect road user behaviour and traffic safety.