Processes for internal logistics are often defined & documented but seldom assessed: are they followed? Are they safe? Are they optimal? What are the root-causes of disruptions/deviations? With 3D and AI analytics, we help you to:


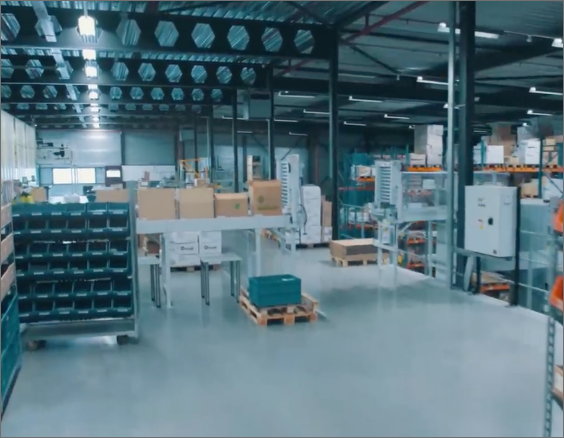
With 3D&AI sensors, combined with flexible data analytics & AI, we enable objective data & insights on personnel, vehicles and material movements and space utilization.
Our solutions help you increase efficiency, resilience and safety by creating visibility through objective data and KPIs. We also help you to assess the potential and effect from AGV/AMR introduction, in your material handling operations (before/after analysis). Well-functioning and efficient internal logistics gives you competitive advantages and accelerates growth.
Our 3D&AI sensors log information on all movements, including positions and speed variations up to 20 times each second – providing detailed insights on traffic intensity, behavior, interactions and accident risks.
Traffic intensity in aisles (indoors/outdoors) – Forklifts, persons, trucks, speed, variations
Monitor intersections – understand and improve safety, before-after analysis
Mitigate incidents and accidents – Real-time warning based on time-to-collision
Workcell monitoring – amount of movement, flow between locations, timing of suboperations, waiting times
Interplay between AGV/AMR and manual forklifts and personnel – Avoid unnecessary stops, smoother movements
Contact us to learn more
Cover large areas and/or many zones with a single sensor. Provides real-time event data on occupied/available space and prediction to full/empty.
Monitor available space in open areas – free/occupied, time standing, forecast: to full/empty
Goods waiting for pickup – Continuous data on presence, amount, volume, orientation
Material supply monitoring – Detect and resupply in time
Obstacle detection – Blocked aisles or emergency-exits
Get in contact with us

Proactively identify bottlenecks & safety issues
Get to know the traffic intensity in each aisle
Before- and after for thorough effect analysis

Are buffer zones used in a optimal way
Detect any obstacles in the fork-lift pathways
Make sure emergency exits are not blocked
Measure: Space usage and workforce movement
Simulate: Gain insights from the digital twin before implementing change

Monitor: Relevant KPI’s to improve operations and detect deviations
Improve: Increase factory safety, efficiency and optimize processes
Modeling and simulation are key to creating optimized factory layouts without unexpected problems, but the results are only as good as the input data. With accurate and relevant data, you achieve more reliable results. By creating a digital twin based on actual real-time measured data, you can run test scenarios to learn possible outcomes and side effects. In an industry that allows no room for error, the software ensures that costly changes will give expected results and nothing else.